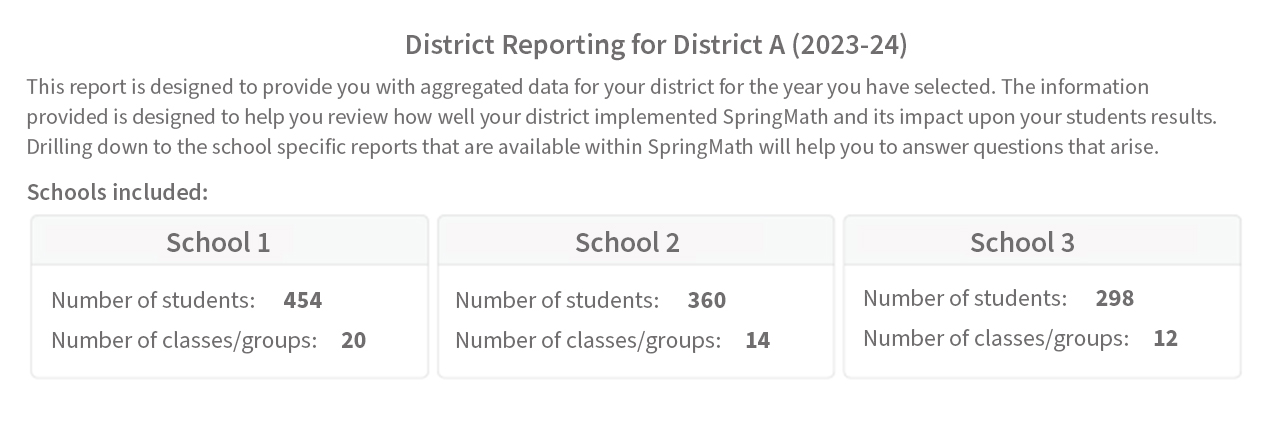
District reporting in SpringMath
By the end of the 2023-24 school year, we will release a new district reporting feature. You will be able to view data similar to the program evaluation, but with additional information and in a new format — all at the district level.
District reporting will make it easier for instructional leaders to see how their district and schools are implementing SpringMath and to see the growth they have achieved. This new reporting will also make it easy to identify areas of strength and areas of opportunity. We hope this new reporting functionality allows you to expand your coaching beyond the class level and school level to the district level.
District Reporting starts with a summary of who is enrolled at your schools.
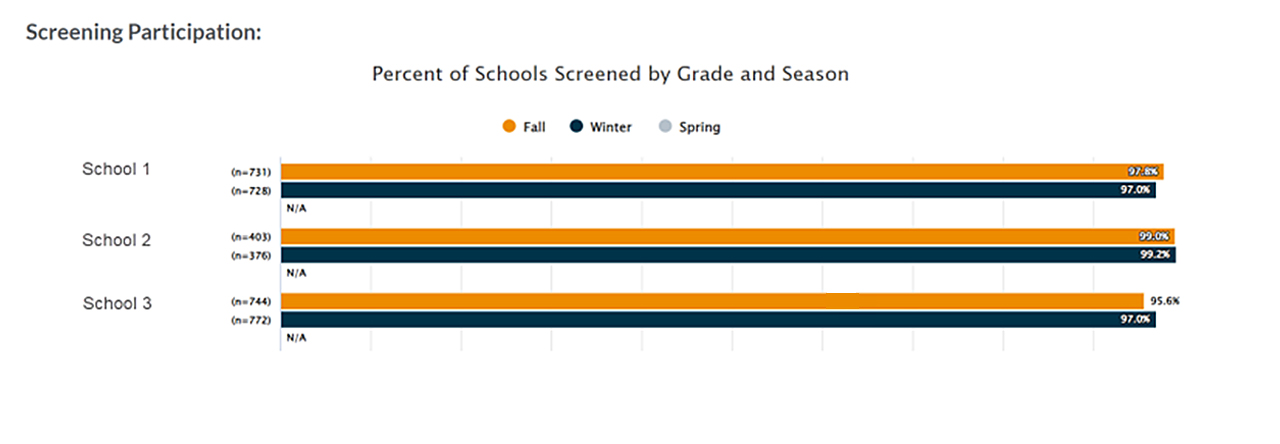
Next, you will see data summarizing your screening participation for the year.
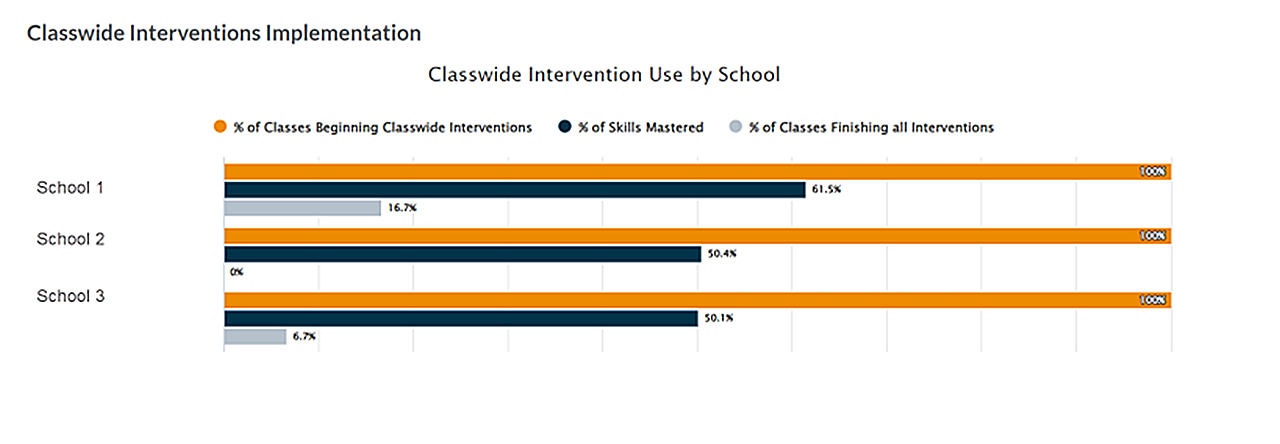
Then, you can view data on classwide intervention implementation and progress.
Next, a new chart will display the average number of skills completed by grade for each school in the district. (This report is currently under development.) This chart will help you see which schools are mastering skills more slowly or rapidly so you can assist schools that may be lagging behind other schools in your district.
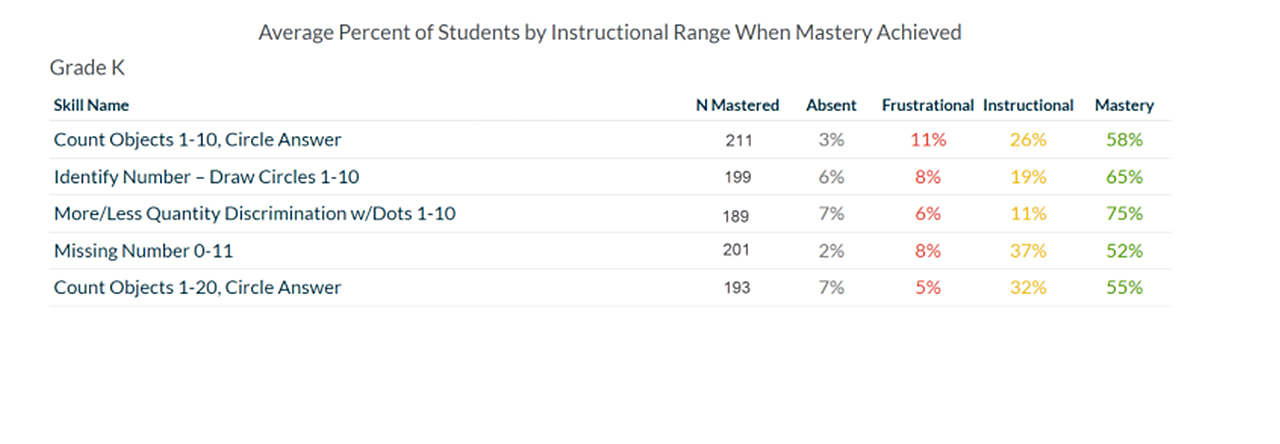
The following chart shows your students’ instructional levels when the class moved on to the next skill in the classwide sequence. This chart is provided for each grade level. Ideally you want the percent of students in the frustrational range to be as small as possible (aim for less than 10%) when the median has reached mastery.
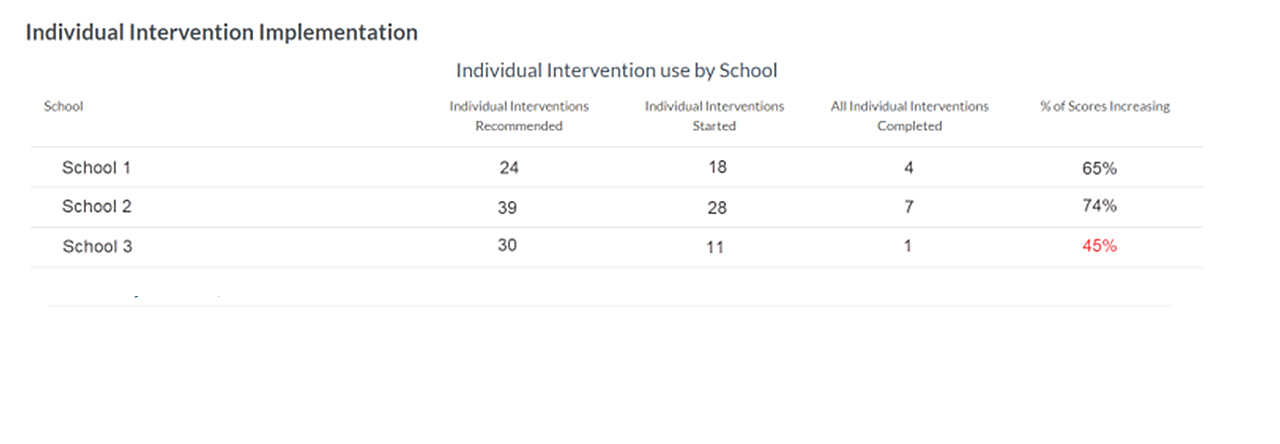
Then, you will see data on how your schools implemented individual interventions.
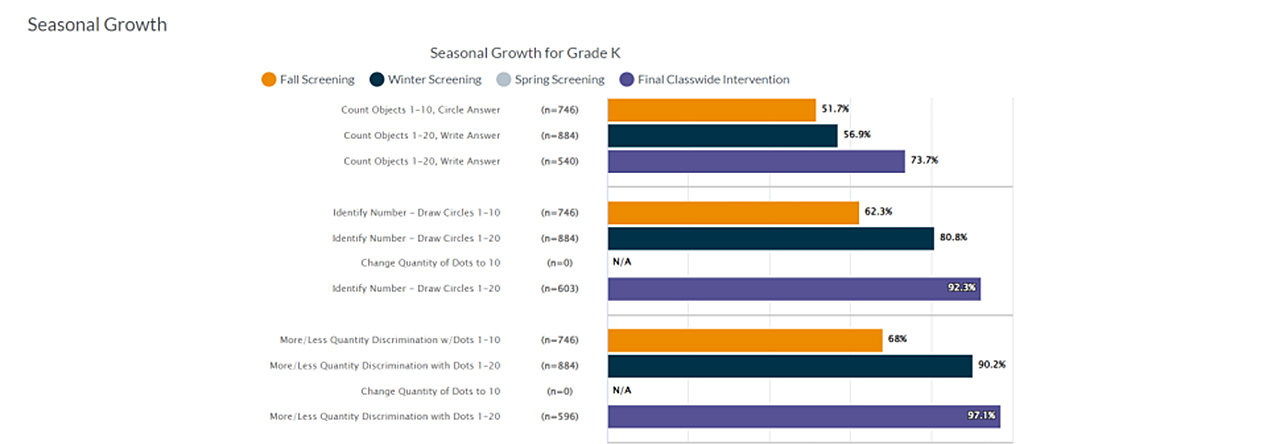
The next few charts detail the growth for all your skills. The first chart is seasonal growth by grade level.
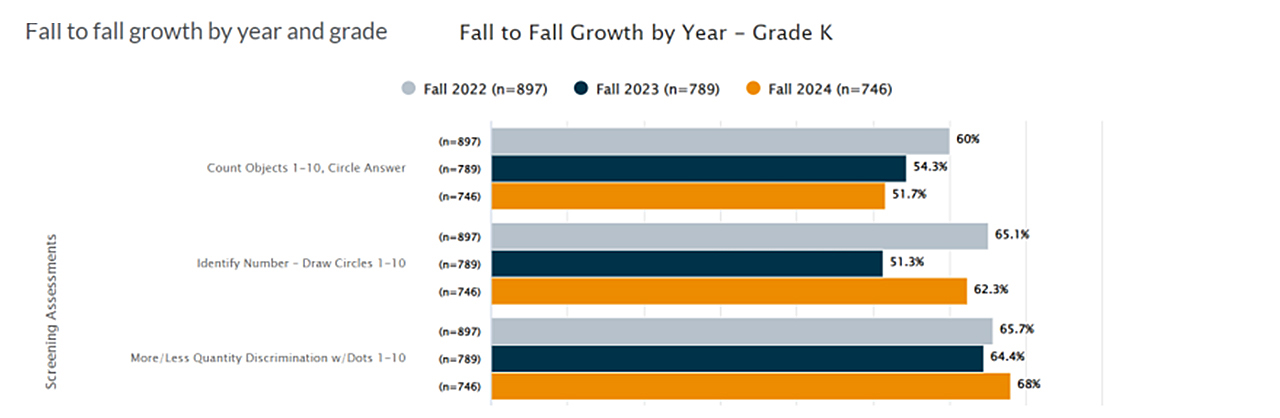
Next is a chart showing the change in your district's screening scores across school years. This chart allows you to see improvements fall over fall in your district (the goal is that more students are scoring in the not-at-risk range each subsequent fall season at a given grade level).
This is provided for each season and grade level.
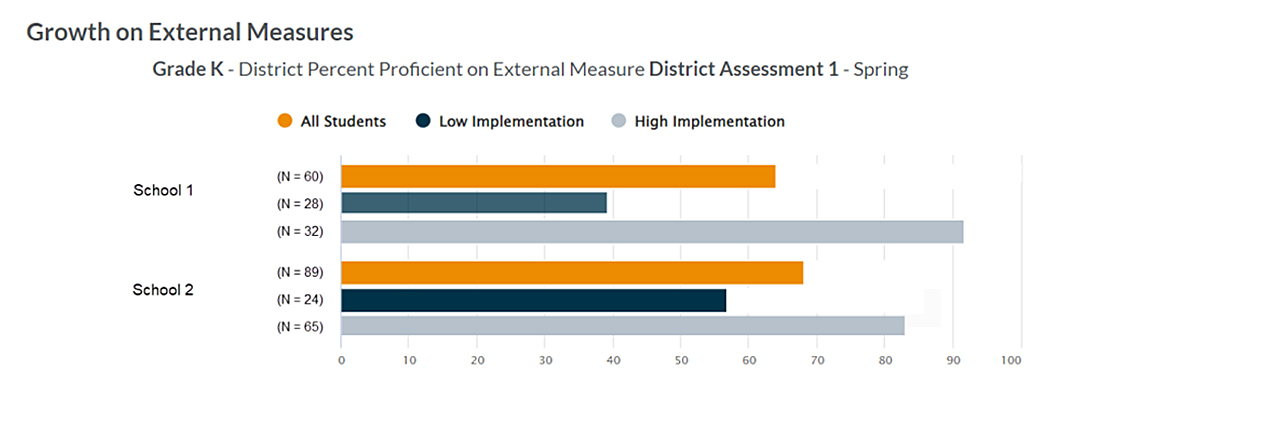
The final charts display your district growth on external assessment measures, both fall to spring and spring across school years for all grades with available data. Your district data administrator must upload assessment files into SpringMath to generate these charts.